The Driftless Slope Map that I created in 2013 is now available for sale from the nonprofit Crawford Stewardship Project. Both posters and postcards are available. Purchases support environmental sustainability in Crawford County, Wisconsin, at the heart of the Driftless Area.
Crawford Stewardship Project works to protect Crawford County and neighboring regions from threats of polluting and extractive industries, to promote sustainable land use, environmental justice, and local control of natural resources.
Crawford Stewardship Project mission statement
The Crawford Stewardship Project is an independent 501(c)3 nonprofit and I receive no royalties or fees from their merchandise sales.
Wisconsin Highway 60 was among several roads damaged by heavy rains in June 2013. Photo by Richland County Emergency Management via the National Weather Service.
The Summer of 2013 began with floods, washouts, and landslides across the Driftless Area, destroying roadways and inundating homes in Wisconsin, Iowa, and Minnesota. These events bring significant losses and make dramatic news, but they are not new. To the contrary, the Driftless Area’s rugged landscape owes its very existence to millions of years of erosion by floodwater, and that erosion is an ongoing process. Widespread human construction, by contrast, is a recent development in this environment. The repeated rains and landslides of the last decade make clear that communities in the Driftless Area must plan their land use for the inevitable occurrence of further flooding and erosion.
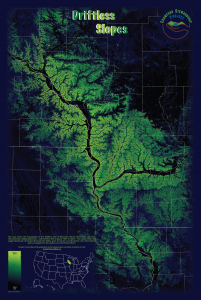
The Driftless Area is prone to flash-floods and landslides in part because of its unique topography, which has a higher degree of slope than surrounding regions. The following map (view map at high-resolution) is colored by slope to highlight this distinction, with steeper hillsides shaded more brightly than level land. The Driftless Area stands out immediately as the bright swath across the center of the map:
The steep terrain of the Driftless Area increases the speed at which run-off collects into drainage channels, ordinarily an advantage, as it dries uplands quickly and prevents water from pooling into stagnant ponds and bogs. During heavy rains, however, water collects more rapidly than some narrow channels can accommodate, leading to sudden flash floods that erode banks and scour new channels. In the meantime, the saturated hillsides — especially those with inadequate vegetation — lose strength and give way, leading to landslides. These are the very processes that created the jagged valleys and steep slopes of the Driftless Area, a landscape forged in unison with running water.
In 1962, the U.S. Congress authorized construction of a flood control dam on the Kickapoo River at La Farge, Wisconsin. The dam would protect La Farge and its downstream neighbors from the Kickapoo’s devastating flash floods. It would also create a 1,780 acre reservoir — “Lake La Farge” — that proponents hoped would draw tourists in search of fishing, boating, and lakefront recreation. Over a hundred farmers and landowners were made to sell their real estate to the federal government beginning in 1969 to make way for the planned reservoir. Construction crews set to work rebuilding Wisconsin Highway 131 around the anticipated lake. In 1971, the U.S. Army Corps of Engineers broke ground on an earthen dam at La Farge.
As work progressed, increased environmental scrutiny revealed problems. Studies showed that a dam would not only alter the local ecology and threaten endangered species in the Kickapoo Valley, but also take a severe toll on local water quality. The expense of maintaining the reservoir also raised concerns. In 1975, with the dam partially in place and half of the affected highway rebuilt, a failed cost-benefit analysis led the Corps of Engineers to halt the project. The cost had been $18 million, coupled with the destruction of the valley’s farming community — an unambiguous example of poor foresight and government waste.
Though Lake La Farge was never filled, the incomplete dam and an abrupt corner in Highway 131 remain as visible reminders of the failed project. Likewise, the property acquired for the reservior remains largely vacant, though it at last found use in 2000 when it was transferred from the Corps of Engineers to the Ho-Chunk Nation and the State of Wisconsin for the creation of the Kickapoo Valley Reserve. The lake that never was thus remains fixed on the mental map of many Kickapoo Valley residents.
I created the map above to define the extent of the planned lake more clearly. The map is based on elevation data I had downloaded from the USGS NED for my Driftless Area Map, and it simulates the area that would have been flooded if Lake La Farge had been filled to the proposed elevation of 840 feet above sea level. The base layer of the map is a mosaic of 2010 aerial imagery from the USDA National Agricultural Imagery Program. The map does not account for sediment deposition and other landscape changes that the dam could have wrought, but it offers a general picture of how “Lake La Farge” might have fit into the modern landscape.
Learn More
Brad’s History – From Brad Steinmetz, author of That Dam History: The Story of the La Farge Dam Project. The Kickapoo Valley Reserve – the valley today, with several pages of history
My home is the Driftless Area — a landscape of rugged hills and coulees that unfolds in steep contrast to the plains of the surrounding Midwest. I’ve long wanted a good map of the area’s unique topography, but this desire has been hard to satisfy. The Driftless Area is flung across the borders of Iowa, Illinois, Minnesota, and Wisconsin, so no individual state map covers the whole region. Moreover, while there are a handful of maps out there centered on the Driftless Area, none that I’ve seen show quite what I want. There was just one solution: I would have to make a map of my own. I have no formal training in GIS or cartography, but maps have fascinated me since childhood, and there is no better excuse than ignorance for learning something new. It took some time, but at long last I’ve made the map I’d been looking for.
The Making of the Region
The Driftless Area takes its name because it is comparatively free of glacial “drift,” the silt and stone carried elsewhere by ice age glaciers. Though prehistoric ice sheets passed the Driftless Area on all sides, this region mostly escaped the scouring glaciation that flattened the neighboring countryside. As a result, the Driftless Area exhibits a more timeworn terrain, visible on the preceding map as a swath of rough relief stretching from northwest to southeast. For all its hills, the area is not mountainous — its highest elevation, at West Blue Mound in Wisconsin, is only 1,719 feet above sea level. In fact, the Driftless Area was built up from sediment in a shallow Paleozoic seabed. Ever since the region rose out of the sea hundreds of millions of years ago, streams have been eroding deep, fractal-like drainage channels into the land, creating its present rough surface.1
Limit of Glaciation around the Driftless Area during the Quaternary Ice Age. This map is based on U.S. Geological Survey Geologic Investigations Series I-2789, “Surficial Deposits and Materials in the Eastern and Central United States,” by David S. Fullerton, Charles A. Bush, and Jean N. Pennell (2004).
During the last 2.5 million years, ice sheets repeatedly advanced and retreated around the Driftless Area. The accompanying map shows the estimated limits of these glacial advances. The most recent glacial maximum, called the Late Wisconsin, can be mapped with great accuracy. In the Late Wisconsin period, ice sheets spanned from Canada to southern Ohio, leaving behind the lakes, drumlins, and moraines that characterize the geography of eastern and northern Wisconsin. Glaciers in this period did not penetrate the Driftless Area, however. Earlier glacial periods are more difficult to map with precision, but it seems clear that the Illinoian Glaciation also passed around the Driftless Area. On the other hand, geologists have unearthed scattered Pre-Illinoian glacial deposits in the western and far northern portions of the Driftless Area. By definition, Pre-Illinoian glaciation took place at least 310,000 years ago. The ice that once encroached into the Driftless Area probably came even earlier — the magnetic polarity of the region’s glacial deposits indicate that they were formed more than 790,000 years before present. As a result, evidence of that early glaciation has had time to mostly erode away.2
The erosion of the Driftless Area was exacerbated by cataclysmic floods that followed each glacial period. During the last glacial phase, meltwater pooled along the northeast periphery of the region, where a combination of ice and hills held back Glacial Lake Wisconsin. The lake created a broad, sandy bed that remains visible today as flat expanse of lowlands across the central part of the state. When this prehistoric lake overcame its constraints, it unleashed floods that eroded the present valleys of the Black River and the Lower Wisconsin River. Similar outpourings of glacial meltwater molded the Chippewa River and Mississippi River valleys. The last retreat of glaciers from Wisconsin between 14,000 and 10,000 years ago established these rivers in their present courses, leaving the Driftless Area essentially in its modern form just as the first humans made their way into the landscape.3
The Making of the Map
Map Detail showing the Mississippi River Valley at Trempealeau. The river cut a section of bluffs away from the others, forming “Trempealeau Mountain” and Perrot State Park in Wisconsin
I wanted my map of the Driftless Area to reveal at a glance the shape of the natural landscape. Human development and labels were less important, as I can find road maps from Yahoo! and Google, and in any case, the cultural features of the Driftless Area tend to rise from their natural surroundings. River valleys such as the Mississippi and Wisconsin doubled as arteries of trade and transportation. Alluvial terraces became building sites for towns and cities like Winona, La Crosse, and Prairie du Chien. Stretches of highland like Military Ridge became thoroughfares linking upland settlements, and prominent features like the Blue Mounds and Trempealeau mountain have long served as landmarks for passersby. A map that makes these natural features visible will therefore expose the foundations of human geography in the region.
After deciding on an emphasis for my map, I needed to collect the geospatial data and software needed to make it. I was able to complete the map with public domain data from U.S. government agencies. To process this data, I relied exclusively on free open source software. GRASS (with GDAL and OCR) did the heavy work of rendering my data sources into graphical map layers, while Inkscape and GIMP aided me with further graphic editing and layer compositing — all on a GNU/Linux operating system.
Land elevation formed the basis for my map. I downloaded local elevation data from the National Elevation Dataset (NED) maintained by the United States Geological Survey. The NED is a raster or grid of elevation measurements spaced at every 1 arc second (1/360th of a degree, or approximately 30 meters) across the entire contiguous United States (other levels of detail, such as measurements at every 1/3 arc second, are also available). I used GRASS to map these elevation measurements in three ways. First, I defined a different color to mark each elevation level — rising from green lowlands to brown uplands. This is a cartographic technique known as “hypsometric tinting,” and it serves to fill the map with color while making it easy to compare the height of distant locations at a glance. Second, I instructed GRASS to draw simulated shadows behind rises of elevation, creating a classic “shaded relief” map. This provides a three-dimensional illusion of the rise and fall of terrain. Finally, in addition to traditional relief shading, I also utilized GRASS to draw subtle “slope shading,” making steeper areas appear slightly darker than flat areas. This outlines hillsides even at angles that standard shaded relief would miss.
As I created these three elevation layers, I also needed GRASS to project my renderings onto a plain — the earth is round, but maps are flat. There is no perfect way to depict the spherical surface of our planet in two dimensions, and as a result cartographers have designed countless map projections that compromise shape or scale in different ways to make the best approximations for different needs. I used the transverse Mercator projection for my map of the Driftless Area, as that projection is ideal for mapping small regions that are longest from north to south. Below are samples of my three elevation renderings — hypsometric tinting, shaded relief, and slope shading — each as a transverse Mercator projection:
After mapping elevation, I added a few more elements. Streams are responsible for the erosion that created the Driftless Area’s topography, so I wanted to show water features in as much detail as possible. I was able to obtain outlines of streams and waterbodies from the USGS National Hydrography Dataset and the U.S. Census Bureau’s TIGER mapping service. I also downloaded state and county boundary definitions from the Census Bureau. Although I left out other human features on my map, I included boundaries to serve as a location reference and enable easy comparisons with maps that emphasize man-made features. As before, I rendered both the water features and boundaries as a transverse Mercator projection using GRASS. I then turned to Inkscape to color and pattern each set of features, creating the maps below:
The printed Driftless Area Poster outside in the Driftless Area
When I had at last prepared each layer of the final map — state and county boundaries, water bodies, and three renderings of elevation — I used GIMP to stack the layers together. The resulting composite map was shown at the start of this article.
I still was not done. It was not enough merely to pan across the map on my computer screen — the only way to study the whole region in detail would be to order a large format print of the map. A print would need to be as polished and informative as possible, so I went back to the USGS for more data and used GRASS and GIMP to create a map of local glaciation (included in part one of the article) as well as a locator map based on the contiguous United States. I inset these additions onto the main map for added reference value in the final printed version. Finally, I embellished the map with photographs showing four seasons of Driftless Area natural scenery. I sent the design away to be printed, and in a few days, I had the map in my hands as a 24 by 36 inch poster.
How to Get a Copy
This map was made to be shared. You can get the 24 by 36 inch print for yourself by ordering the Driftless Area Map Poster from Zazzle. I wouldn’t hawk the poster if it wasn’t absolutely the best way to see the map in all its detail. A portion of your purchase also helps keep this website alive and free of outside advertising.
Not ready to buy the poster? No worries! I’m also giving the map away as a 1280-pixel JPG for screen viewing. It’s not quite the same as having the print for your wall, but it is free. Just right click on Download the Driftless Area Map and select the “Save” option from your browser’s context menu.
Notes and References:
Robert H. Dott, Jr., and John W. Attig, Roadside Geology of Wisconsin, (Missoula, Montana: Mountain Press Publishing Co., 2004), pp 119-128, 158.
David S Fullerton, Charles A. Bush, and Jean N. Pennel, “Surficial Deposits and Minerals in the Eastern and Central United States (East of 102 Degrees West Longitude),” U.S. Geological Survey Geologic Investgation Series I-2789, (2004). [http://pubs.usgs.gov/imap/i-2789/]; Dott and Attig, pp 131-134.
James Theler and Robert F. Boszhardt, Twelve Millenia: Archaeology of the Upper Mississippi River Valley, (Iowa City: University of Iowa Press, 2003), pp 19-32; 58-68; Dott and Attig, pp 134, 166-179, 199-205.
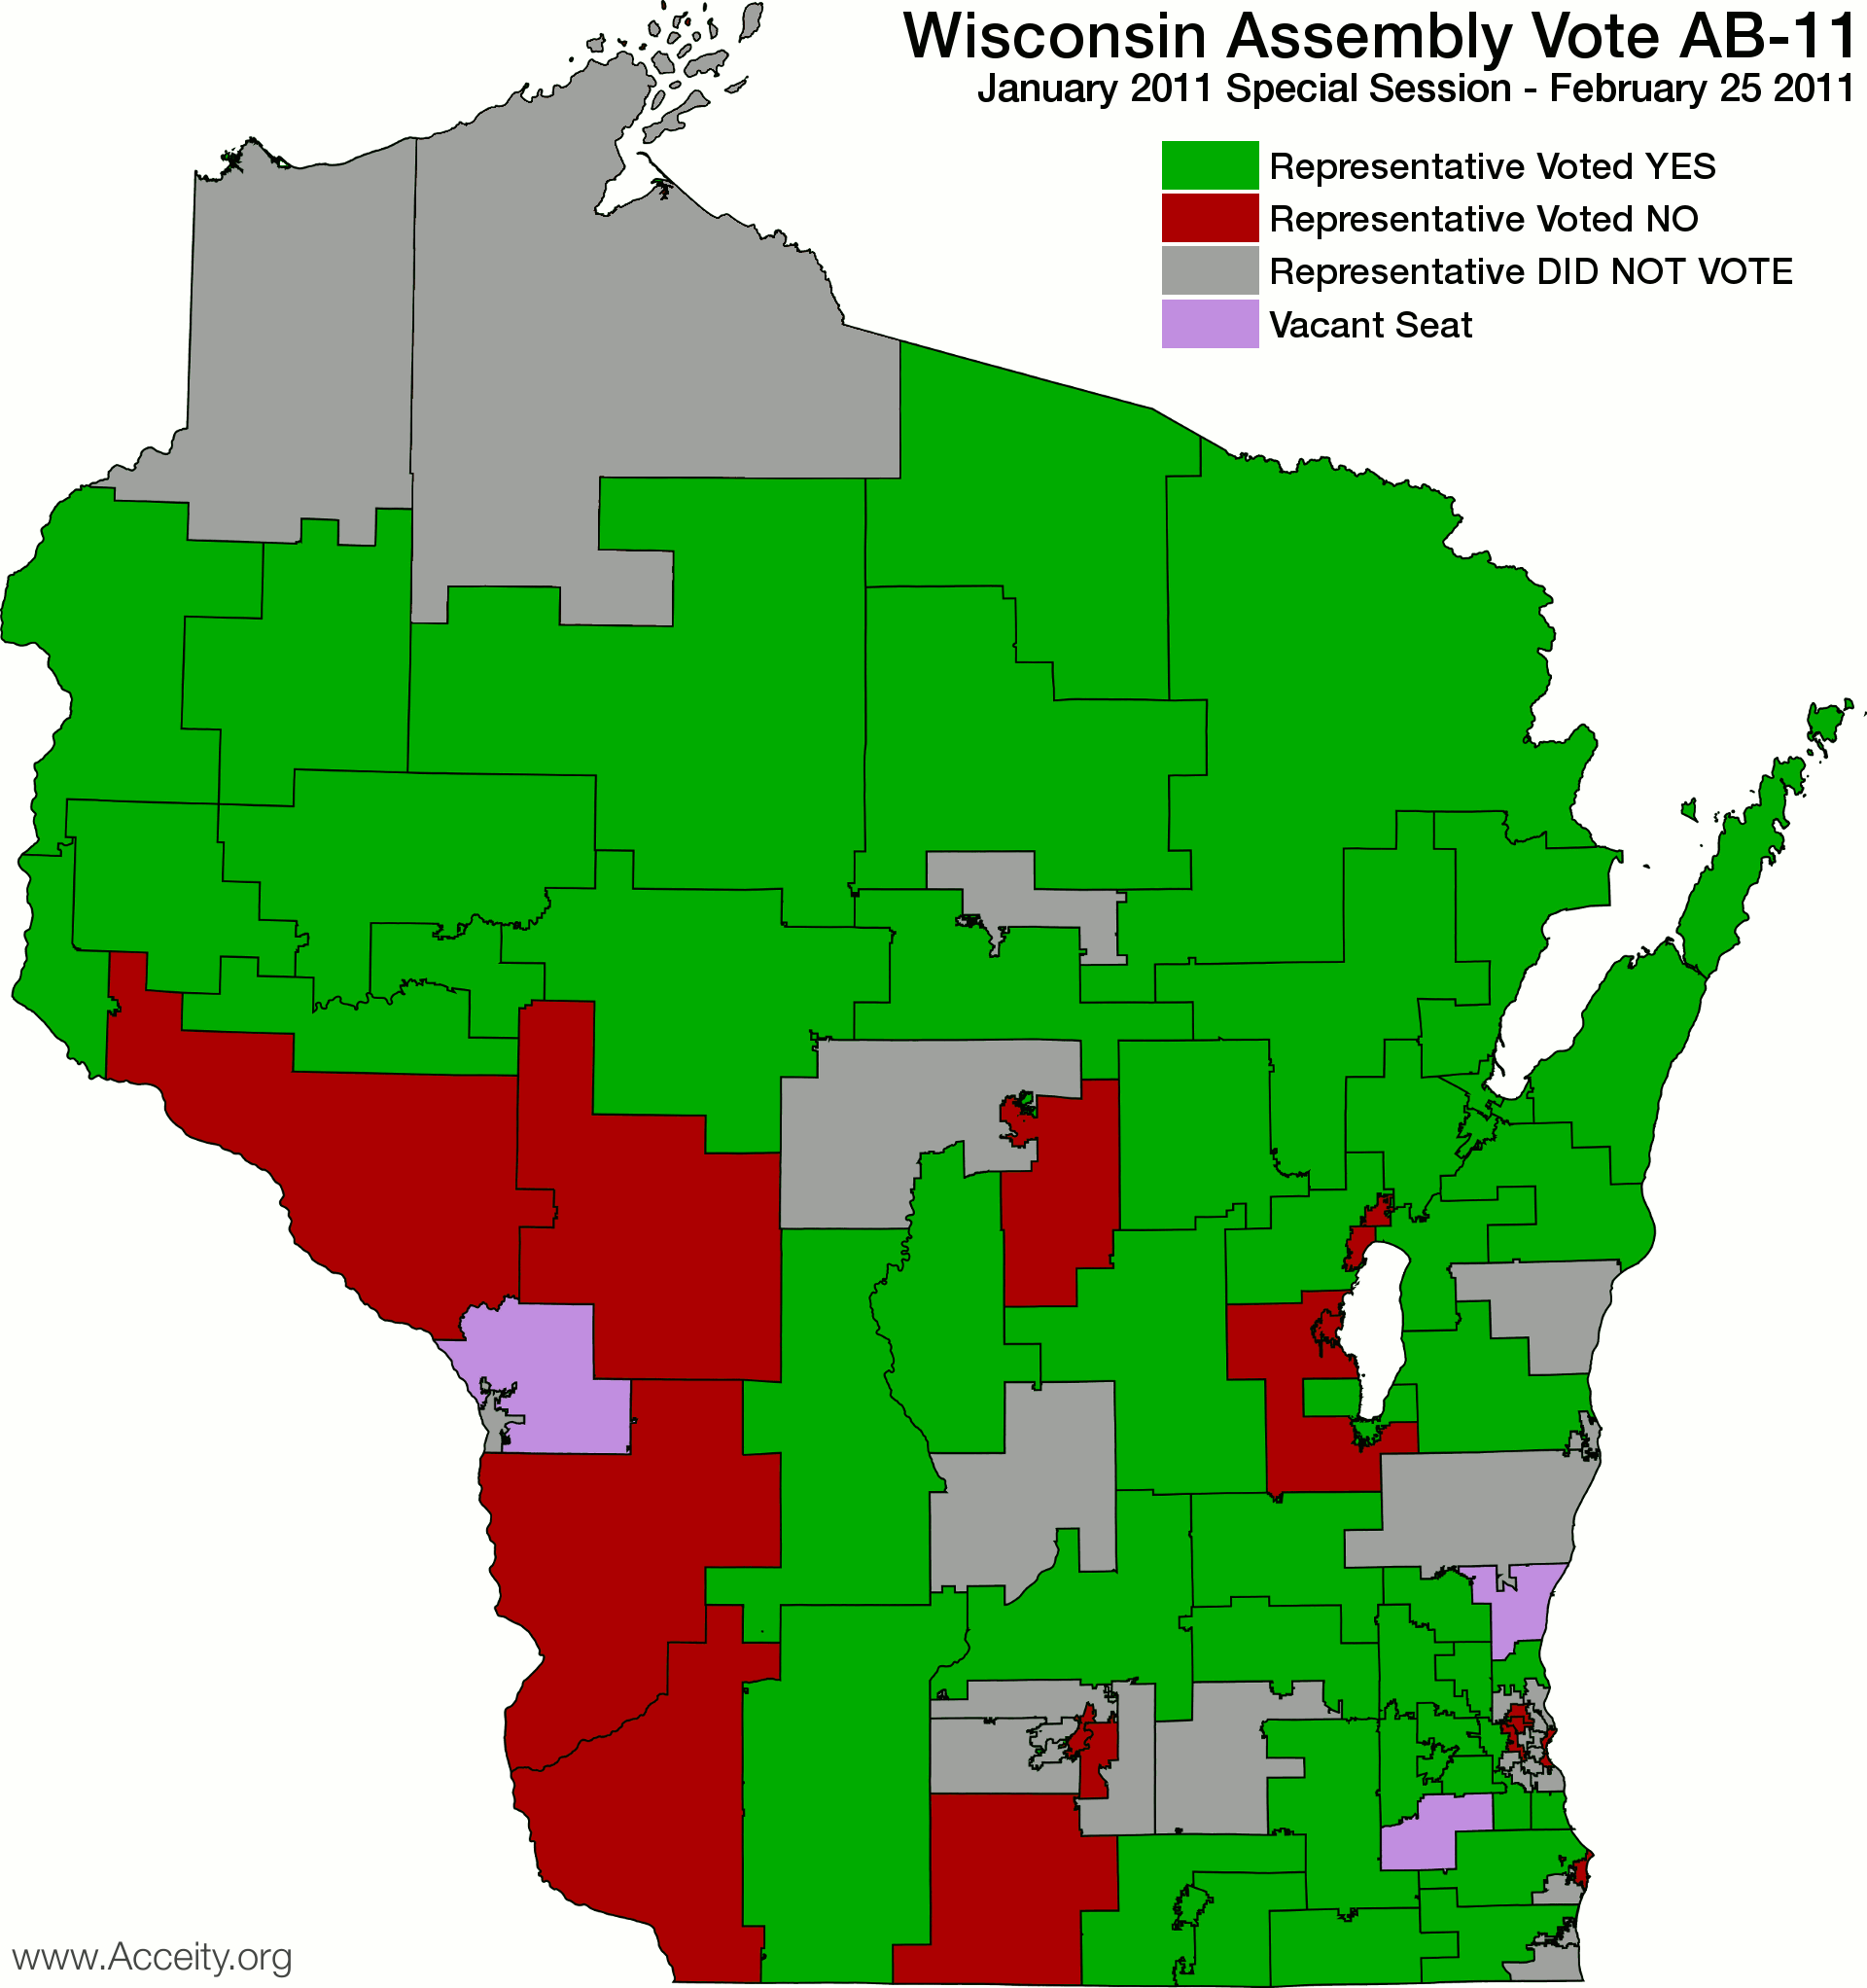
By now just about everyone has heard about the contentious Wisconsin Assembly vote early Friday morning that approved Governor Scott Walker’s contentious “budget repair” bill in mere seconds — without even allowing time for the entire assembly to vote! Since I couldn’t find a map of the vote anywhere else, I decided to make one myself. Now it is easy to see whose representatives have been listening, whose have not, and whose weren’t given a chance to represent their constituents at all.
You are welcome to copy and share this map. If you want more information, you can access the full vote roll from the Wisconsin State Legislature website. They also offer detailed and numbered maps of the state assembly districts.
Edit: The map has been corrected to show that Janet Bewley (D) of District 74 (Ashland) did not get in a vote. I apologize for any confusion caused earlier.